Ben Gaffinet, Applied Physicist at RSS-Hydro, explains how Machine Learning can help in flood mapping, creating valuable maps even from clouded satellite images to support disaster response.
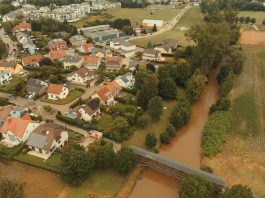
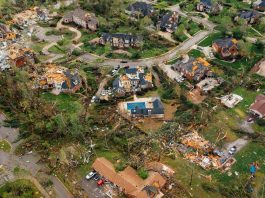
Floods are the most common type of disaster in the 21st century, with a single flood event potentially affecting hundreds or thousands of people. Current disaster response efforts rely on ground monitoring methods which are only scarcely available in developing countries. This leads to local response teams dealing with not only scarce resources but also limited or uncertain information. Uncertain information can divert the response teams’ efforts to locations that are not or only minimally affected while missing information increases the risk of critically impacted locations not being identified at all.1
To enable an efficient and effective response, reliable information for large spatial areas is required. Earth Observation (EO) data is an obvious candidate to fulfil this need. However, uptake has been slow, mostly due to two significant limitations, namely interpretability of data and missing data due to cloud cover.
Role and limitations of Earth Observation in flood mapping
An ever-growing variety of instruments are being deployed in orbit providing an extraordinary opportunity to guide response activities on ground. For floods, two instruments are prime candidates for flood mapping, namely Synthetic Aperture Radar (SAR) and optical sensor each coming with their own benefits and drawbacks.
SAR has the major advantage of detecting floods through cloud coverage but is hard to interpret without extensive expert knowledge. The introduction of freely available SAR data is as recent as 2014 with the launch of Sentinel-1A.2 As a consequence, historical archives are limited.
Optical Imagery is available for free for a much longer time with the introduction of Landsat in 1975. An abundant quantity of historical data is available, enabling the study of many past events. A user of Google Maps might be familiar with optical imagery through the satellite layer. This familiarity facilitates the interpretation of provided maps by laymen. Nonetheless, a major drawback exists for optical images. During floods persistent cloud cover is frequent thus hiding vital information. Additionally, floods manifest differently depending on the terrain and soil type, making some unprocessed optical images tricky to interpret.
FloodSENS – value from optical imagery
The FloodSENS project, developed by RSS-Hydro in partnership with ESA’s InCubed programme, focusses on optical imagery exclusively with the goal to provide timely information for large spatial areas. To create usable and valuable maps, flood mapping needs to be extended as much as possible below clouds and presented in a user-friendly way.
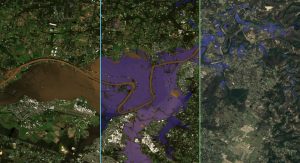
Fig. 1 shows a mock-up of the projects goal which is separated in three parts. On the left, a simple optical (e.g. Sentinel-2) image is shown without any pre-processing. An untrained person will mostly be able to recognise flooded areas by the presence of a homogeneous brown colour. In cases where clouds are present it becomes quickly impossible to estimate the flood extent. In the middle, the extent of the flood is included as a semi-transparent blue overlay. Ideally, in a next step the mapping should seamlessly continue below potential clouds. On the right, the detected flooded areas are overlaid on top of a Google Satellite image instead of the original optical image. No clouds will obstruct the view and infrastructure is visible as it has been recorded before the flood. Response teams will be able to spot where the flooded area intersects with settlements or critical infrastructure and use it for planning.
Machine Learning approach
Machine Learning methods essentially learn correlations between their input and the expected output through provided example. For FloodSENS, the most important input is the optical satellite image. By providing examples of known floods from the past, the algorithm is expected to learn about the typical colour and shape of a flooded area. To succeed, the flooded areas need to be visible because the colour will be the key information the algorithm has to work with. As soon as clouds are present, this simplistic approach will break down.
Luckily, a global digital elevation model (DEM) is freely available. A DEM describes the height above sea level of the terrain. The location of floods is driven by the terrain’s elevation and slope. Water will always flow downhill and accumulate in depressions or rivers that might overflow. With a DEM, the Machine Learning algorithm can start spotting corelations between low laying areas, the slope, and the flood extent.
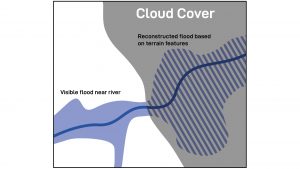
Fig. 2 serves as an illustrative example: a valley is flooded but the cloud cover is important and inhibiting the planning of a response mission. From the cloud-free part the algorithm can identify flooded areas based on the colour of pixels and the shapes of connected surfaces. By having the elevation available as information, the algorithm can reconstruct the flood extent based on the terrain elevation and slope.
Additional data, such as soil type and land use, can be introduced to train the Machine Learning algorithm even further. We adopt an approach to start with minimal information and slowly build up the complexity of the Machine Learning algorithm to meet important accuracy requirements.
Current status
FloodSENS development is in an early stage, but first results have supported the feasibility under the current approach. In a future article we will present actual results and discuss our efforts to support successful humanitarian responses.
References
- Guy J.-P. Schumann, ‘The need for scientific rigour and accountability in flood mapping to better support disaster response’, 2019 https://onlinelibrary.wiley.com/doi/abs/10.1002/hyp.13547
- UNAVCO, ‘Synthetic Aperture Radar (SAR) Satellites’. https://www.unavco.org/instrumentation/geophysical/imaging/sar-satellites/sar-satellites.html
Please note, this article will also appear in the seventh edition of our quarterly publication.