The D4RUNOFF project is turning complex urban runoff data into clear, climate-informed risk maps that help cities identify pollution hotspots and plan practical nature-based solutions (NBS) with confidence.
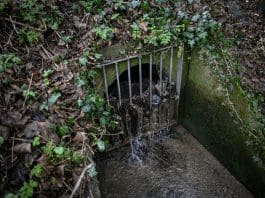
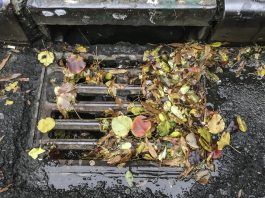
Urban runoff is an invisible everyday problem and one of the most overlooked environmental risks cities face today. When it rains, water flows over roads, rooftops, and paved surfaces, collecting pollutants such as heavy metals from building materials, tire residues, hydrocarbons, and other contaminants. This polluted runoff is then carried into streams, wetlands, and coastal waters, often without treatment.
One of the goals of D4RUNOFF is to address this issue with a practical, city-friendly solution: transforming complex environmental data into clear, actionable risk maps. These maps show where pollution is most likely to occur both today and under future rainfall scenarios, so local authorities can prioritise action where it matters most.
At the core of this innovation is Mitiga Solutions, a Barcelona-based climate risk intelligence SME and member of the D4RUNOFF consortium. Mitiga Solutions designed the project’s risk-mapping methodology to translate raw environmental data into intuitive decision-making tools for city teams.
What problem is urban runoff creating for cities?
Urban runoff pollution is difficult to manage because it is diffuse (it doesn’t come from a single source), event-driven (triggered by rainfall), and variable (changes by season, land use, and traffic intensity).
Many municipalities lack tools that connect rainfall data, land use, and pollutant thresholds into a unified risk picture. Without this integration, teams often rely on reactive maintenance rather than strategic prevention.
D4RUNOFF changes that dynamic by combining monitoring data, modelling outputs, and visual tools into one AI-assisted digital platform.
What is D4RUNOFF building?
D4RUNOFF developed an AI-assisted digital platform that hosts:
- Pollutant-specific risk maps
- NBS planning tools
- Monitoring data integration
- Climate-adjusted rainfall projections
- Scenario comparison features
These tools are currently being applied in three pilot cities: Odense (Denmark), Santander (Spain), and Pontedera (Italy). Register and try out the AI-assisted platform!
The platform enables utility operators, planners, and policymakers to:
- Identify pollution hotspots
- Compare neighborhoods visually
- Explore potential green infrastructure interventions
- Evaluate how risks may change under future rainfall patterns
Because risk maps sit alongside NBS options, such as rain gardens, green roofs, permeable pavements, and wetlands, cities can connect diagnosis with action in the same environment.
How does mitiga solutions turn raw data into clear risk maps?
Mitiga Solutions designed D4RUNOFF’s first complete runoff pollution risk-mapping methodology.
The process integrates open city datasets (surface types, drainage systems, land use maps), rainfall records and climate projections, field monitoring data, environmental safety thresholds, and hydrological and pollutant transport modelling.
The result is a spatial risk index that shows where pollutant concentrations are likely to exceed safety levels, how often exceedances are expected, and how risk changes under future rainfall intensities.
These maps can be viewed by individual pollutant (e.g., heavy metals, tire-derived substances) and as a combined multi-pollutant risk layer.
Instead of complex technical charts, the output is visual and intuitive, using colour gradients and probability signals that make comparison easy across districts.
This shift from raw data to visual risk intelligence is what enables day-to-day operational use.
How was the model validated in the real world?
Models are only valuable if they reflect reality. To validate the risk maps, D4RUNOFF partners VCS and the University of Copenhagen conducted a large-scale citizen science campaign in Odense during spring and summer 2025.
Volunteers collected more than 300 runoff samples across different rainfall events and urban areas.
The findings confirmed key observations:
- Pollutant concentrations were generally higher in the city centre
- Tire-related substances showed a strong link to road traffic intensity
These real-world measurements were then used to calibrate and tune the model, ensuring the risk maps respond accurately to rainfall dynamics and urban surface conditions.
This “ground truth” integration increases trust in the platform’s outputs.
What do the risk maps actually tell a city team?
- Where should we look first?
Hotspot identification allows crews to prioritise inspection of drainage inlets, maintenance of critical nodes, small pilot interventions, and targeted monitoring campaigns to act strategically against urban runoff pollution.
- How often is pollution likely to occur?
The maps do not simply show presence or absence of risk: they also display probability and recurrence frequency in intuitive colour scales. This allows planners to answer questions like:
- Is this a once-per-year issue or multiple times per season?
- Which neighborhoods face the highest recurring risk?
- How will frequency change with more intense rainfall events?
This probabilistic approach supports both operational and long-term infrastructure decisions.
- What NBS could work here?
Because risk layers are integrated with NBS planning tools in the D4RUNOFF’s AI-Assisted Platform, users can explore rain gardens, constructed wetlands, green corridors and permeable pavements.
Cities can compare how these interventions may reduce pollutant transport over time and evaluate potential effectiveness before investing.
This integration shortens the gap between risk assessment and intervention planning.
What’s next for D4RUNOFF?
Mitiga Solutions is now finalising Version 2.0 of the risk maps, with improvements including enhanced validation and expanded pollutant categories (where reliable datasets exist)
The objective remains simple: create usable, trustworthy, climate-informed maps that support everyday municipal decisions, whether that’s scheduling maintenance or planning a street redesign.
Please Note: This is a Commercial Profile

This work is licensed under Creative Commons Attribution-NonCommercial-NoDerivatives 4.0 International.