Rebecca Emerton, Climate Scientist at the Copernicus Climate Change Service (C3S), discusses the findings of the recently published European State of the Climate (ESOTC) report and implications for Europe’s climate landscape.
As climate change accelerates, understanding its regional impacts has never been more urgent. In Europe, rising temperatures, extreme weather, and shifting climate patterns are reshaping ecosystems, economies, and daily life. Each year, the ESOTC report provides a comprehensive assessment of these changes, combining vast amounts of observational data with scientific expertise. Produced by the C3S and the World Meteorological Organization (WMO), the report is a key resource for policymakers, researchers, and the public.
We spoke to Rebecca Emerton of C3S to gain insights into the latest edition of the ESOTC and the significance of its findings for Europe’s climate future.
Please can you explain how the data for the ESOTC is collected? Have there been any changes this year compared to previous years?
The ESOTC report uses a wide variety of datasets – around 40 for the 2024 edition. These datasets are collected in many different ways, including from weather stations, ships, ocean buoys, aircraft, and more. Some are used directly, while others feed into the creation of additional datasets. We also rely heavily on satellite data and reanalysis datasets. Reanalysis combines observed and satellite data with computer models to fill in the gaps where we don’t have observations, giving us consistent global coverage.
We collaborate with around 100 scientists across Europe and globally. Each expert analyses the datasets they specialise in and shares their findings with us. Together, we write the different sections of the report based on those analyses.
In terms of what’s changed since last year, we consistently review with our expert network whether new datasets should be included or whether new topics warrant coverage. For example, this year, we added a full chapter on lakes, which we’ve only briefly covered in previous reports. Given the continued focus on heat, we also introduced a new variable: tropical nights – where temperatures stay high overnight – which adds insight into how heat affects health.
One of the biggest changes this year, though, was in how we present the content. We worked hard to focus on the key messages, highlight the most interesting charts, and streamline the report to make it more concise and impactful. We also introduced a new graphics gallery with over 120 charts, making the data much more accessible and user-friendly.
One standout finding this year was that Europe is the fastest-warming continent, and it was the hottest year on record. Why is Europe particularly vulnerable?
I noticed you used the term “vulnerable,” which includes multiple factors like exposure to hazards and the capacity to adapt and mitigate them. However, focusing on why Europe is warming faster than other continents, we can see that there are a few contributing factors.
One is that part of Europe extends into the Arctic, which is the fastest-warming region globally. Arctic warming influences Europe’s overall rate of warming. There are also changes in atmospheric circulation that are contributing to more frequent and intense summer heatwaves, further amplifying the warming trend.
Another factor we highlight is the reduction in aerosol emissions across Europe since the 1980s. Aerosols tend to cool the atmosphere by reflecting sunlight, so their reduction has contributed to increased warming as well.
How does 2024 compare to previous years in terms of climate trends? Are we seeing a steady increase or a more dramatic acceleration?
Globally, the five-year average temperature is now about 1.3 to 1.4°C above the late 19th-century baseline. But that rise hasn’t been entirely linear. For instance, between 2003 and 2012, the change was relatively modest. Since 2015, however, the global average temperature has risen much more sharply.
If you look at the past 30 years, the average warming per decade is higher than if you look further back to 1980. We see a similar pattern in Europe, where the average temperature over the past five years is around 2.5°C above pre-industrial levels – about one degree more than the global average. Again, this suggests an accelerating trend in warming, particularly over recent decades.
As for 2024, it aligns closely with these long-term trends. It was the warmest year on record, with numerous heat-stress days, significant glacier melt, and widespread flooding – all consistent with what we expect as the climate continues to change. One unusual feature this year was the strong east-west contrast in weather across Europe, which really stood out in the report.
That east-west contrast was quite striking. What are the implications for sectors like agriculture or energy supply? What’s driving this contrast?
It’s a fascinating question and one we’re still exploring. Typically, climate projections talk more about north-south contrasts in Europe, so this east-west divide was a bit unexpected. It was mainly driven by atmospheric circulation patterns last year.
In terms of impacts, it really depended on where you were in Europe. Eastern Europe experienced warmer and drier-than-average conditions, which led to drought in some areas – affecting agriculture and water supply. Southeastern Europe, in particular, saw extreme heat and one of the longest heatwaves on record, resulting in widespread heat stress.

Western Europe, on the other hand, may not have felt like it was the warmest year, but it still saw above-average temperatures and significantly more rainfall, which increased flood risks. So, while the types of impacts varied, they were substantial across the board.
Will this unusual east-west pattern be something you monitor in future reports?
Definitely. In addition to the annual report, C3S also publishes monthly climate bulletins covering both Europe and the globe. These updates allow us to track ongoing patterns like this one and assess whether they persist.
And yes, unfortunately, many of those monthly bulletins have reported new records being broken, month after month. We hope for the day when that’s no longer the case. But until then, we’ll keep monitoring and include any emerging patterns in next year’s report.
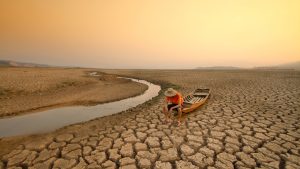
The report said that around 400,000 people were affected by storms and flooding. What does this say about Europe’s infrastructure and preparedness?
That’s right – preliminary data from the international disaster database estimated that around 400,000 people were impacted by storms and floods last year.
The report draws on key findings from the Intergovernmental Panel on Climate Change (IPCC), which highlights that Europe is one of the regions facing the highest projected increase in flood risk. This year, we had a special section on climate policy and infrastructure resilience, which looked specifically at how Europe’s built environment is coping with climate extremes.
While there have been improvements, especially in cities, the European Environment Agency’s latest climate risk assessment indicates that flood risk could reach critical or even catastrophic levels later this century under high-emission scenarios. Urban areas are especially vulnerable due to increased surface runoff during heavy storms. So yes, more action is urgently needed to adapt infrastructure to meet these challenges.
What about heat stress and its impact on health? Can our healthcare systems cope?
That’s a real concern. It’s also something I focus on in my own research. In the UK, where I’m based, we’ve already seen media reports of hospitals struggling during heatwaves.
As temperatures rise and heatwaves become more frequent and intense, the health impacts will only increase unless we adapt. If we don’t plan for this now – whether through urban design, early warning systems, or bolstering healthcare infrastructure – the strain on services like the NHS could become overwhelming.
I can’t comment directly on how governments are responding. But our role is to provide the most up-to-date and accurate data possible so policymakers can make informed decisions. I hope that the evidence we provide can support better planning and preparedness.
The report also highlighted record glacier loss. How close are we to irreversible damage, and what could this mean for sea levels and ecosystems?
I’m not a glacier specialist, but the trend is clear: glaciers are melting, and we won’t get that ice back. All glacier regions in Europe lost ice last year. Central Europe is among the fastest-receding areas, alongside Iceland and other global hotspots.
The glacier indicator in the report estimates that since 1976, glacier melt has contributed more than 25 mm to global sea level rise – with about 40% of that just in the past decade. In recent years, the sea level has risen above average due to this acceleration in glacier loss. So yes, the implications are serious.
If there’s one key takeaway from this report that you’d like to share with every European citizen, what would it be?
The headline is, of course, that Europe saw its warmest year on record and is the fastest-warming continent. But beyond the statistics, I’d highlight the huge collaborative effort behind this report. Around 100 scientists came together to analyse state-of-the-art data and tell the story of our changing climate.
So, I’d say: listen to that story. Read the report. Talk about climate change. Let it inform your decisions. That collective understanding and awareness is essential for action.