Agricultural policies are complex things that must take into account the various changing situations in different areas, and the BESTMAP project will provide a framework to do just that.
The BESTMAP project focuses on developing a flexible, interoperable, and customisable framework that will consider farmers’ needs and effectively model agricultural policy impacts on natural, social and cultural assets in rural areas.
Existing impact assessment models do not appropriately address the complex farmers’ decision-making processes and ignore the wider impacts of agricultural policy on natural, social, and cultural assets in rural areas. Through a bottom-up approach, BESTMAP’s new modelling framework has the potential to transform the design and monitoring of future EU rural policies, promoting a sustainable future for the EU agricultural sector.
Here, we briefly present the conceptual framework of BESTMAP and discuss the lessons learned from this Horizon 2020 project towards an operational pan-European policy impact modelling tool.
Spatially explicit biophysical and socio-economic models were developed in five case studies — the Mulde river basin in Germany, Catalonia in Spain, the Bačka region in Serbia, the Humber in the UK, and South Moravia in Czechia. The aim of modelling was to enable the estimation and mapping of the effects of selected agri-environmental measures on biodiversity (farmland birds), water quality, soil carbon, food production and net farm-added value.
The Farming System Archetypes (FSA) used for modelling represent a generalised typology of farming systems assumed to have similar responses to agricultural policy changes. The FSA framework defines main farm characteristics based on two dimensions: Farm specialisation and economic size. Both dimensions were calculated and mapped for every farm within the case studies using data from the IACS/LPIS data collected by each Member State. Farms belonging to the same FSA are assumed to have similar decision patterns regarding the adoption of Agri-Environmental Schemes (AES).
Additionally, agent-based models were parameterised to explain the adoption of AES by individual farms. The outputs of these models were used to parameterise farm-level regression models, and a novel approach was developed to assess how well these models can be transferred across FADN regions. All outputs were translated into policy-relevant indicators and integrated into policy notes and an online dashboard for data visualisation and decision-making.
For more information about the outputs of BESTMAP project visit www.bestmap.eu
Scaling up the BESTMAP approach
In the BESTMAP upscaling phase, meta-models were created for ecosystem services (ESS) in NUTS3 regions within each case study area. These meta-models used the case study ecosystem service model results as response variables, incorporating expert-opinion-based initial sets of potential explanatory factors from environmental and economic predictors. Employing variable selection techniques refined these variables for each ecosystem service in each NUTS3 region.
The resulting meta-models predicted outcomes for NUTS3 regions across all case study areas, with the coefficient of determination (R2) gauging prediction accuracy. R2 values were then plotted against the differences between case study NUTS3 regions regarding key environmental and socioeconomic variables (the ‘Minkowski distance’) per Ecosystem Service (ESS). This approach helped assess the ‘transferability’ of ESS results to non-case study NUTS3 regions in Europe. Results meeting specific criteria indicated a high level of confidence, allowing the transfer of findings to new regions based on their Minkowski distance.
Some NUTS3 regions in Europe were challenging to predict using the existing methodology due to substantial Minkowski distances from the current case studies. This suggests that for future iterations of BESTMAP, new case studies in different locations would be essential. To optimise resource allocation, additional case studies should ideally encompass and closely represent regions not adequately covered in the initial BESTMAP project. This section aims to identify potential locations and determine the required number of representative future case studies if BESTMAP were to be replicated.
The methodology was split into two parts. The first involved establishing the representativeness of all NUTS3 regions in relation to each other, while the second involved identifying regions where confidence levels were inadequate for the transfer of ecosystem service outcomes based on the existing BESTMAP case studies.
Representativeness of all NUTS3 regions in relation to each other
Hierarchical clustering was utilised to identify NUTS3 regions that were well-represented by others. This technique groups similar regions based on multiple variables. Each data point begins as an individual cluster and is subsequently merged into larger clusters, ultimately forming a dendrogram – a tree-like structure. Dendrograms indicate which regions exhibit the highest degree of similarity and provide an overall picture of how all the regions are connected.
Identifying regions for future case studies
The location of the most useful future case studies required the identification of areas that are not currently sufficiently covered, as determined by the transferability criteria. To identify such regions, any NUTS3 region that met the transferability criteria more than five times for any one of the ESS was excluded.
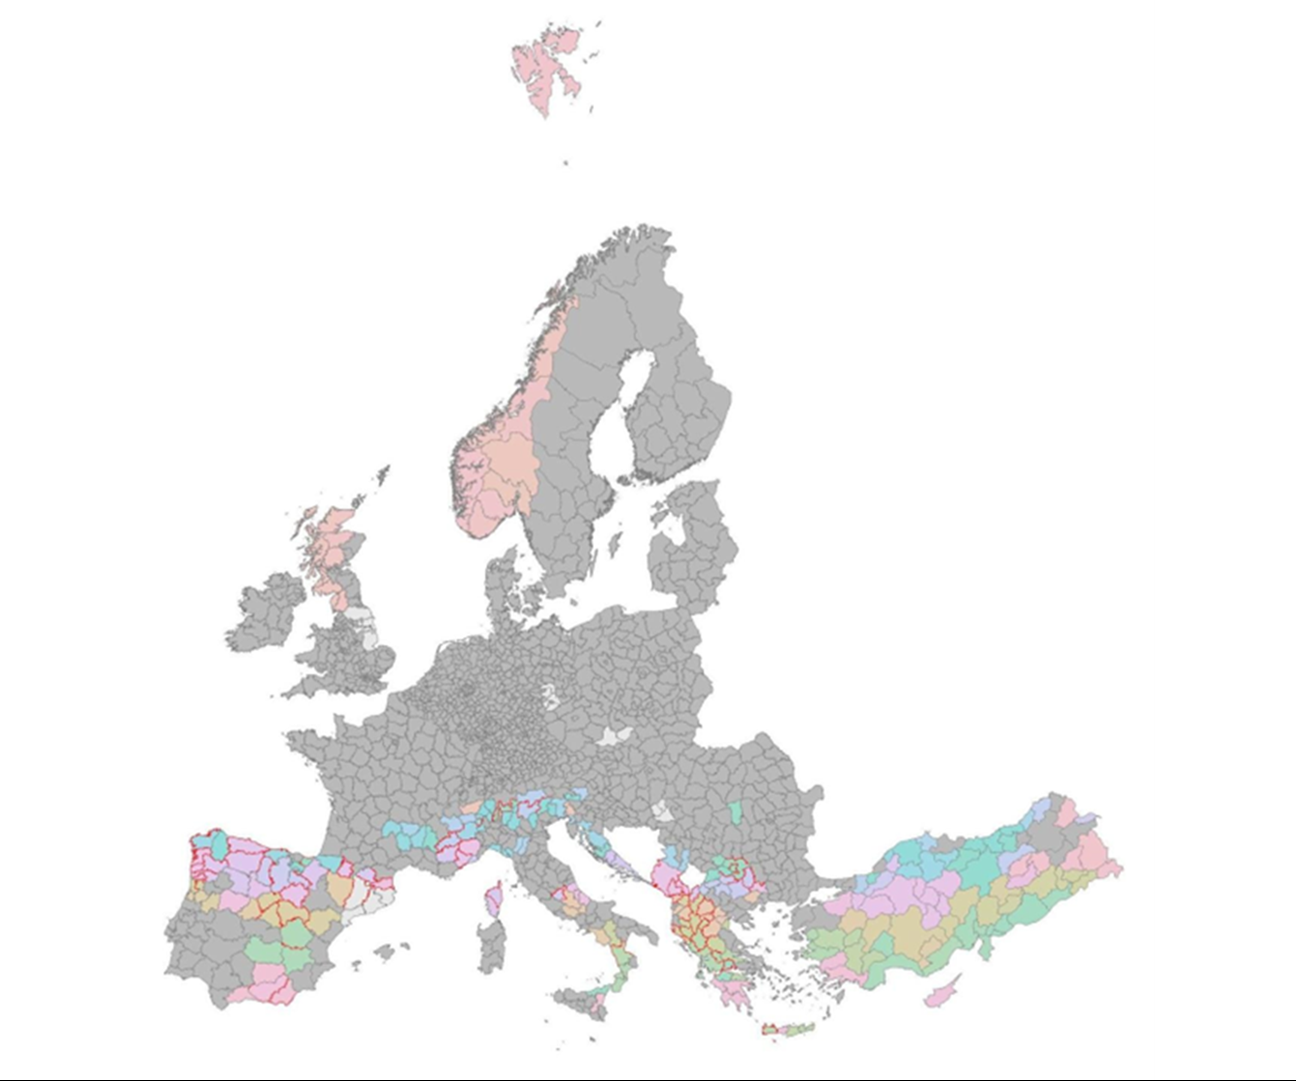
The resulting map was reduced to 166 cluster combinations. It highlighted different regions where transferability confidence is low, based on the current BESTMAP case studies. These identified regions serve as potential locations for future case studies in order to be able to cover all of Europe in terms of transferring ESS models run at the case study level.
To create a more defined shortlist consisting of five or fewer suitable locations, as addressed by the BESTMAP project, a more refined criterion was employed: Any NUTS3 region that met the transferability criteria more than three times for any one of the ESS was excluded from the map, which gave fewer but more distinct regions. By conducting this further analysis, we identified regions that align with the current project’s goals and have the potential for successful implementation (see Fig. 1). This process suggested future case studies might be in northern Spain, north-west Italy, central Italy, Montenegro/Albania, and Bulgaria.
It is important to note that the outlined methodology represents the initial phase in identifying new case study regions. Equally important is the involvement of local stakeholders, including government officials and communities, to acquire insights into the unique challenges and opportunities specific to each region. These challenges may encompass issues such as obtaining relevant regional-level data, such as LPIS (Land Parcel Identification System) data. The ultimate objective is to select regions that not only align with project criteria but also have the potential for long-term impact and sustainability.
Development and validation of a Europe-wide nutrient run-off model
In BESTMAP, unique ESS models were developed for each case study region. To scale these up and enhance agricultural policy relevance, approaches to assess the transferability of these local ESS models to all other parts of Europe were developed.
BESTMAP has also assessed an alternative approach, applying a single model across Europe, using Europe-wide data sources to parameterise the model. Specifically, we carry out a Europe-wide application of the InVEST Nutrient Delivery Ratio model (NDR) for estimating run-off of nitrogen (N) and phosphorus (P) from agricultural land. This NDR model was also applied in the case studies.
Model output was validated against within-river nutrient concentrations measured under the European Environment Information and Observation Network (Eionet), a partnership network of the European Environment Agency.
The model had a relatively high accuracy in predicting both N and P concentrations in rivers, but with discrepancies at lower predicted values of N and at higher predicted values of P. Further analysis of these discrepancies will allow us to suggest improvements to the models and their parameterisation. The models showed that nutrient losses are large from grasslands with a high stocking rate, such as in the Netherlands, Ireland, western Denmark and parts of France and Germany. Low amounts of nutrient loss are found in regions without widespread intensive agriculture such as in parts of Scandinavia and southern Europe.
Data needs for biophysical modelling in agricultural landscapes
While the situation has slightly improved over recent years with the advent of novel datasets, such as those derived from remote sensing (such as COPERNICUS), the challenges persist, especially when it comes to the availability of data for biophysical modelling in agricultural areas. The complexities of agricultural systems demand detailed and up-to-date information on soil characteristics, weather patterns, land use changes, and crop dynamics.
In many regions, the insufficient sharing of relevant data, the absence of standardised formats, and the reluctance of stakeholders to contribute information continue to hinder the development and refinement of effective biophysical models. It is crucial to prioritise overcoming these data limitations, as enhancing data availability not only benefits the scientific community but also empowers farmers. Improved access to data enables farmers to make well-informed decisions, especially when considering significant changes in their practices.
During the BESTMAP project, significant data sharing challenges were overcome. In particular, with data coming from the Farm Accountancy Data Network (FADN). Here we highlight a few recommendations:
1. Improving the usefulness of the Farm Sustainability Data Network (FSDN) by including more detailed information on land management, precise land-use aspects such as intensity, farming practices, pesticide application, fertiliser application, agricultural yields per crop and area, and land tenure (owned/leased land);
2. Improving access to spatial FSDN data to allow access to micro-level anonymised data;
3. Improving compatibility of FADN/FSDN to other European data, in particular LPIS/IACS system; and
4. Addressing issues related to the sampling/regions used in FSDN – i.e. including better representation of organic farms and involving smaller farms.
Piloting synthetic FADN generation
The Farm Accountancy Data Network (FADN) is a comprehensive database that captures pivotal characteristics within the agricultural landscape and is thus highly suitable for exploring the above questions and hypotheses.
However, including personal and confidential information poses a challenge for widespread utilisation due to privacy concerns and legal considerations surrounding protecting sensitive data. In navigating this delicate balance between widespread utilisation and confidentiality, the integration of synthetic data emerges as a promising technological solution, safeguarding sensitive data, improving the accuracy of Machine Learning models, and mitigating bias.
We harvested the Synthetic Data Vault library (SDV), a comprehensive set of tools that covers the entire analytical pathway, including data preparation, modelling, sampling, quality evaluations and visualisation to generate synthetic data that mimics FADN data.
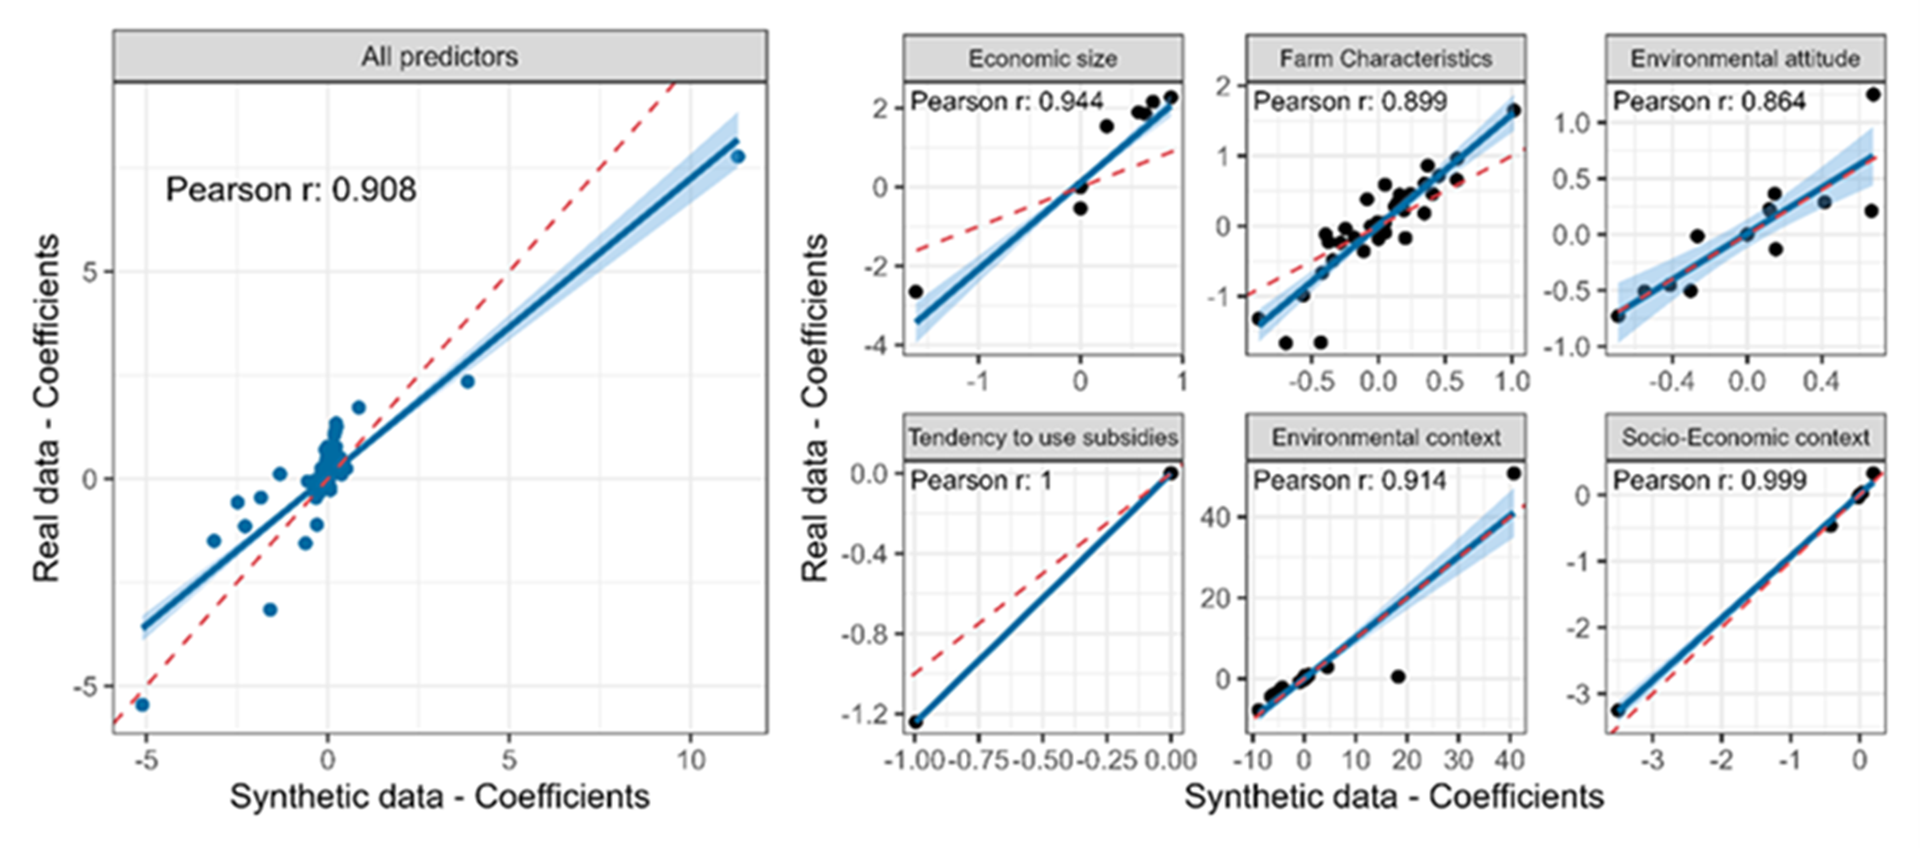
The results are encouraging: The analysis based on synthetic data retained a similar number of features, conserved the overall ranking of hypotheses-focused models, produced coefficients that are strongly correlated to the coefficients of real data (see Fig. 2), conserved similar frequencies of features we consider essential, and conserved high correlation between coefficients even within a single feature. This suggests we have found a good balance between information content and confidentiality.
Improving agri-environmental policy in Europe
Based on the project results BESTMAP proposes several strategies for improving the effectiveness of Agri-Environmental Schemes (AES) in the EU.
- Improving spatial targeting: BESTMAP proposes the use of archetype analysis to help understand spatial patterns in AES adoption and tailoring policies to specific farming contexts. This approach can enhance AES effectiveness by customising schemes to different farming systems.
- Local co-development of AES: Involving farmers in designing AES can increase uptake and align agricultural actions with environmental goals. Co-design processes allow for testing and optimising measures in the field, maximising ecological and economic benefits.
- Better advisory support: Farmers have indicated a lack of relevant advice when it comes to AES application and implementation. Providing accessible and free advisory services can reduce bureaucratic burdens, equip farmers with necessary skills, and guide them in choosing suitable AES. Advisory services should cover ecological advice and administrative support.
- Revisiting AES payments: Current payment levels based on income foregone may not align with farmers’ decision-making. Higher payment rates reflecting the value of ecosystem services could increase AES uptake. A reevaluation of the payment approach is suggested to allow for payments that support public goods through public funding that goes beyond damage compensation.
- Improving Monitoring of AES Success: Consistent monitoring guidance, stakeholder interactions, and adaptive planning are essential for assessing AES impacts effectively. More comprehensive monitoring data is required to inform future policy decisions.
- New Vision for AES Design: BESTMAP proposes a more adaptive and multi-scale approach to EU agricultural policy, integrating bottom-up AES developed with farmers’ input, enhanced advisory services, targeted top-down AES, and improved monitoring within a flexible policy cycle.
Please note, this article will also appear in the seventeenth edition of our quarterly publication.