RSS Hydro takes a look at geospatial data proliferation, accessibility, and sharing – old and new problems in the era of climate risk assessments.
Clearly, we have entered an era of geospatial data proliferation and a massive expansion of digitalisation. As data sources and providers have been multiplied, the data volume generated has been constantly increasing.1 This leads to new challenges, often related to data procurement, storage, usage, and maintenance. The procedures developed to face these challenges are manyfold and need to be tailored to every type of data and field of activity.
An era of geospatial data proliferation
In recent years, we have witnessed a multiplication of data sources. With this comes a large number of actors and organisations who are responsible for managing, updating, and sharing information. Satellite imagery is probably one of the most proliferating sources of geospatial data, with many thousands of satellites now in orbit and many more being launched almost every day. These all need to be operated, updated and replaced, and oftentimes this involves a number of different actors, ranging from large space agencies, such as European Space Agency (ESA) and National Aeronautics and Space Administration (NASA), to companies and other types of organisations. A lot of geospatial image data also comes from drones and aeroplanes, as well as many types of handheld mobile devices. This situation is rendered more complex by the fact that a large variety of different sensor and instrument types are used to acquire these geospatial data, and the purpose differs from one to another. Consequently, imagery can then lead to important derivative information such as landcover data, water body extraction, and disaster impact mapping, which are created by a large number of different experts within many organisations in different sectors, ranging from universities to research laboratories, humanitarian organisations, and many private industries.
Alongside image data, there are also many other data types, such as meteorological data, coming from satellites monitoring the atmosphere or from ground stations or weather balloons. These data are used to build complex numerical weather models for forecasting the weather but also climate extremes. International and national organisations, as well as private companies, specialise in managing those data and transforming it into valuable information.
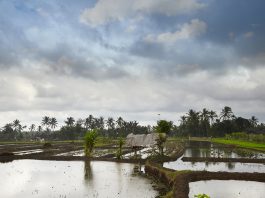
Another important source of data collection is fieldwork, often carried out at a very local level. Collecting data linked to urbanisation, water quality, health of vegetation, types of constructions, demographic and population behaviour are some examples of data where fieldwork is an essential source.
The data collected can be merged into one or several applications, such as flood modelling and risk mapping, where topographic data and river measurements are the main prerequisites to model the hazard component, which can be merged with land cover and land use data as well as demographic data to derive impact assessments.
However, the proliferation of data we are witnessing does not only concern data that is currently measured and collected, but also data from the past which has been digitised and stored in huge databases or may still exist in an analogue form on paper or tape recordings. Historic and past data are vital to better understand the environment and climate we live in, and to get a better handle on improving models to predict the future.
These are, of course, only some examples of data types we might encounter, and listing all of the different geospatial and environmental data types and sources that exist would become too time consuming. In fact, often a given dataset newly produced and becoming freely available may already exist from another or even sometimes the same source. Indeed, there seems to be duplication of data in some cases, especially when such data or information are produced from many different research projects. Schumann discussed parts of this issue in the context of flood mapping during disasters, when many flood maps may be produced from the same satellite image by different organisations and then shared with the same disaster response teams.2 This ‘firehose’ of data can confuse end users and may therefore result in a counter-productive outcome. Of course, looking at it from a scientific perspective, the existence of very large volumes of data is easily justifiable by the highly variable characteristics implicit to each data source or algorithm.

When it comes to geospatial data, there can be differences linked to resolution, spatial, and temporal. The resolution chosen for a product’s output always depends on the aim, the geographical location and size of the area of interest, and the resources needed (human as well as financial resources). Naturally, the results will always differ because they are related to a specific project and/or purpose. Moreover, the higher the resolution and the bigger the geographical area, the heavier the data gets. Therefore, it is important to find a balance between resolution, capabilities and overall purpose. Furthermore, data can be similar in the final results, but the methods used to get there can be completely different and based on (an)other type(s) of (initial) dataset(s). Another important aspect is the fact that each person involved in the data creation has his or her own personal way of interpreting the data, which can slightly alter the output information.
Data accessibility and sharing
The previously mentioned complexity of data holders and creators is not in line with easy and quick dissemination of data. The processes of acquiring data can be difficult in some cases. There is a great inequality in data access in terms of open and free access to data on the one hand and the need for a permission-to-access process on the other hand, not to mention the cases where it is impossible to obtain permission to share data. Open access data has a very large international community supporting the free dissemination of data for public and professional use. Indeed, many data producers offer their data for free. This can be the case for satellite imagery, landcover and topography data or more specific data linked to natural hazard modelling for instance.
Unfortunately, these data are often accompanied by restrictions such as limited spatial and/or temporal resolution, incomplete data, or only occasional updates. However, progress has been made in recent years to improve the volume and quality of open access data. One well-known initiative is OpenStreetMap, which tackles the lack of data for things such as global building footprints and roads, particularly in poorly mapped areas. An important aspect regarding the open access strategy is that these data need to be updated regularly, requiring important financial and human resources. Efforts need to be made to keep geospatial data openly accessible for a long time and in a sustainable manner. Conversely, a large volume of data are not freely and openly accessible, often because they are very high-resolution data or financed under a specific project, which does not allow for sharing it freely. In some cases, geospatial data may be shared under specific conditions, or some data may be intended for a specific research project, for humanitarian activities after a disaster, or under financial compensation.
Furthermore, accessing the data might not always be the first barrier people may encounter. Knowing about a dataset and finding it can be challenging in some cases, especially datasets created specifically for one precise geographical location and managed by just a few individuals. Some more efforts need to be put into knowledge transfer to help people access useful, often high-quality data, especially for areas which are poorly covered. The FAIR principle is trying to achieve this. FAIR data are data which meet principles of findability, accessibility, interoperability, and reusability.
Transforming into usable data
New data which have been downloaded can be difficult to manage at first and cannot always be used in their original state. Large datasets need to be ‘cleaned’ and ‘organised’, for storage reasons, but also to facilitate their processing.1 This process will also allow the user to assess the data quality and if it can help the user achieve the set targets. Modifications that need to be made to the data to make it usable can vary from changing geographic projections systems in order to visualise and use the data properly, to translation from one language to another or transforming the data into another, more adequate format. Then, data often needs to be harmonised, especially if data from multiple sources are used at the same time.3
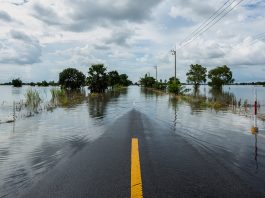
Example of flood risk assessment under changing climate conditions
Assessing flood risk under a changing climate needs a certain amount of data provided by multiple sources.
First, climate data are needed to simulate the evolution of climate into the future, but also to analyse past events. The ERA5 from the European Centre for Medium-Range Weather Forecasts (ECMWF) and the climate model simulation ensembles CMIP-5 and -6 datasets, all available through the Copernicus Data Store (CDS), are examples of climate datasets, which can be used in such studies. Locally, field-measured data can also be used to analyse the past but also to introduce actual high-magnitude rainfall events to a flood hazard model. However, depending on the type of data needed, some datasets do not offer a long enough historic archive to look at the past, due to the lack of measurements in the past, which can limit the reanalysis of that data.4
Secondly, river discharge data also need to be collected, either based on field measurements or based on global hydrological models that transform rainfall into discharge, depending on the availability of data. Typically, in European countries, the US, Canada or Australia, field data are often available due to a dense measurement network on those countries’ rivers. In less developed countries, there are few on-site measurement stations. Global models can then be used to have a rough estimate of a river discharge and can be used as input to a flood hazard model.
Thirdly, complementary data need to be downloaded in order to complete the simulation processes or risk assessments. Having a digital elevation model (DEM) is essential for a flood model and general hydrologic analysis. This can be derived from satellites, but also from an overflight by a drone or plane. The resolution and the quality of geospatial data vary a lot when it comes to topography. High-resolution data get difficult to manage very quickly, especially for large geographical regions. The higher the resolution and the larger the area of interest, the bigger the storage capacities needed and the longer the processing time. This type of high-resolution topography data can be found easily in advanced economies, but it is often not that easy, or is even impossible, to have these type of data in less developed countries. Global DEMs covering the entire world, such as the Copernicus DEM, is a good alternative in such cases.
Finally, other complementary data, such as a city’s drainage system and landcover can be available for free, depending on the level of accuracy the user is aiming for and the processing capabilities. A city’s drainage system is usually managed by a specific organisation responsible for its maintenance, and the data provider may need the city’s approval to be sharing that data. Landcover data are usually manifold. On the one hand, global datasets exist, such as ESA’s WorldCover dataset which is updated once a year, or Google’s Dynamic World, which is updated more frequently. These are especially important for poorly mapped areas of the world. On the other hand, national databases offer landcover data, very often for free, which are very important input data in any flood risk assessment. In a subsequent step, these outputs can be cross-referenced with data of a city’s buildings and their location, as well as their structure and the characteristics of inhabitants, to study population and building exposure, vulnerability and level of risk. The buildings can be retrieved from national databases or from open access data sources such as OpenStreetMap. Lastly, data regarding a building construction type usually has to be collected in the field, or through a building information model (BIM) database, if available, while data on the population characteristics can be more easily obtained from local or national authorities.
References
- Hessler I. The need for expanding spatial data capabilities: Challenges and opportunities. ACENET
- Schumann G.J-P. 2019. The need for scientific rigour and accountability in flood mapping to better support disaster response. Hydrological Processes. Wiley
- Cai L. & Zhu Y. 2015. The Challenges of Data Quality and Data Quality Assessment in the Big Data Era. Data Science Journal
- Faghmous J.H. & Kumar V. 2014. A Big Data Guide to Understanding Climate Change: The Case for Theory-Guided Data Science. In. Big Data. September 2014. pp. – 155-163
Please note, this article will also appear in the fourteenth edition of our quarterly publication.