Guy Schumann, CEO and Founder of RSS-Hydro, discusses the power of visualisation in mitigating risks and increasing climate resilience.
We are in a world of changing climates, the impacts of which are visible and can be felt almost every day in recent years. Most of these impacts are negative and can cause devastation to entire ecosystems and human society and impact climate resilience. In some cases, these devastating events are responsible for the loss of lives as well as huge economic losses.
Climate change causing floods, droughts and fires of unprecedented spatial scale and destruction can result in financial shocks that are triggered by the increasing economic costs of crossing ecological boundaries. Inattention to issues such as climate change can create a build-up of systemic financial imbalances from such ecological pressures.1
Preventing an increase in vulnerability to climate change and fostering climate resilience can help withstand financial crisis2 and also strengthen disaster preparedness, response and recovery. In this context, the London School of Economics and Political Science defines resilience to climate change as the capacity to prepare for, respond to, and recover from the impacts of hazardous climatic events while incurring minimal damage to societal wellbeing, the economy, and the environment.3
Technologies to improve climate resilience
Technological innovation plays a big role in increasing climate resilience. New technologies are increasingly seen as being able to provide solutions to address risks and fatalities caused by accelerating climate change.4
Improving climate resilience involves assessing how climate change will create new, or alter current climate-related risks and taking steps to better cope with these risks. International organisations, inter-governmental institutions, and many nations’ governments are raising awareness and investing in many programmes and initiatives to increase climate resilience.
At a smaller scale, cities and local communities are responding by investing in infrastructure updates and climate-smart planning to mitigate the impacts of acute and chronic events. For example, a combination of nature-based solutions and building or drainage system improvements, like planting street trees and installing green roofs, can help mitigate extreme heat and reduce flood impacts.
Climate resilience, adaptation and preparedness can also be increased through the involvement of communities and citizens more or less directly in relevant projects. This can take many shapes and forms, ranging from direct inclusion of citizens in measurement, monitoring or mapping activities, for example, to more indirect engagement through educating the general public in relevant workshops, tabletop exercises and surveys or via effective communication techniques, such as photographs, interactive maps, and more recently 3D visualisations or Virtual Reality (VR) gaming activities.
These tools can increase knowledge dissemination, helping community members understand climatic and environmental changes. In a paper promoting visualisations as a tool to increase community engagement in climate change adaptation decision-making, DeCock-Caspell and Vasseur argue that visualisation techniques have been utilised in many disciplines but have not been widely embraced by climate change scholars.5
The importance of visualisation
It is clear that today, there is no shortage of technologies and tools that can be used for visualisation and storytelling about a place or event. One of the best ways to do this – mixing geospatial information content, photos and anecdotes – is by using ‘story maps’. These are very effective tools for raising awareness about extreme events, climate resilience, and other topics. Story maps, such as the popular Esri ArcGIS StoryMaps, are created through the generation of dynamic digital content that resonates with any audience. These powerful storytelling products allow one to combine text, images, videos, and interactive maps. They represent a visual storytelling journey filled with immersive content. They are often used to clarify complex topics that affect people and help raise awareness about a certain topic or increase resilience.
At RSS-Hydro, we make it our mission to develop products and services that are helping our customers and communities to become more climate resilient while also achieving several Sustainable Development Goals (SDG) targets focused on water-risk reduction. In our activities, communicating risk and our solutions to mitigate risk to the public, policymakers, and government authorities is a top priority. To achieve this in the most effective way, we have recently partnered with big tech companies and combined their newest technologies with open-source software tools to render cutting-edge 3D visualisations of our flood risk simulations and mapping solutions.
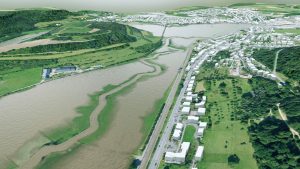
For instance, we use various geospatial datasets with NVIDIA’s scene-generation platform, Omniverse, to build realistic 3D visualisations of disaster impact that help with increasing climate resilience of vulnerable communities.
Our publicly available video about Tropical Cyclone Idai that hit the Mozambique coastal areas demonstrates the effective combination and seamless integration of various geographical information system (GIS) and Earth observation (EO) layers using open-source data transformation plug-ins and Omniverse for a state-of-the-art rendering and visualisation experience.
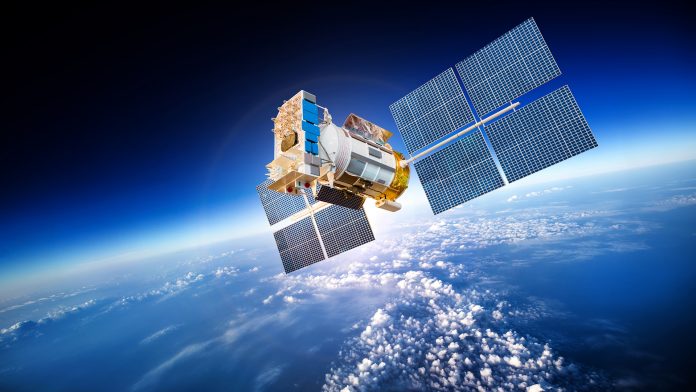
For this particular use case, we used data layers from the European Commission Copernicus programme, Open Street Map, and results from a flood mapping algorithm. Mozambique is one of the poorest and most vulnerable countries in Africa and is constantly exposed to extreme weather events. The lowlands of the Zambezi River Delta offer a great ecosystem but are regularly exposed to destructive storms from the Indian Ocean and extreme monsoonal rainfall. In March 2019, Idai, one of the deadliest tropical cyclones, hit the region and brought intense rainfall in addition to a massive storm surge. Luckily, there are many satellites passing over the region during such events that monitor the ongoing impacts and provide critical information content that can help save lives and reduce damage.
Visualisation for flood mitigation
At RSS-Hydro, with support from the European Space Agency (ESA), we developed FloodSENS, an Artificial Intelligence (AI) algorithm, to detect flooded areas, even in the presence of cloud cover. FloodSENS uses satellite images of floods and elevations of land to map the rising waters during extreme weather events.
We also create high-end 3D visualisation videos from our numerical flood model simulations and add those as effective risk communication features to our existing SafeCityTM service portfolio. This service is designed to provide cities and businesses with high-precision city-wide flood risk simulations of current and future climate conditions. Plug-and-play capabilities of our living coupled surface to a sub-surface flood model help clients mitigate risks and plan and prepare infrastructures, assets, homes, and urban landscaping accordingly. It also incentivises cities and businesses to look for climate-resilient solutions, as well as invest in appropriate and sustainable risk-protection measures.
Turning complex scientific outputs and messages into easy to understand ‘stories’ using state-of-the-art 3D visualisation techniques is clearly key to reducing climate vulnerability, increasing climate resilience, and achieving several of the sustainable development goals faster and more efficiently.
References
- Schoenmaker D. & Van Tilburg R. Financial Risks and Opportunities in the Time of Climate Change. Bruegel Policy Brief, Issue 2016/02 (2016). https://www.bruegel.org/policy-brief/financial-risks-and-opportunities-time-climate-change
- Jalles, J.T. Financial Crises and Climate Change. Comp Econ Stud (2023). https://doi.org/10.1057/s41294-023-00209-7 ,
https://link.springer.com/article/10.1057/s41294-023-00209-7 - Mehryar S. What is the difference between climate change adaptation and resilience? The London School of Economics and Political Science (2022). https://www.lse.ac.uk/granthaminstitute/explainers/what-is-the-difference-between-climate-change-adaptation-and-resilience/
- Kaundinya P.S., Perné N. & Türkeli S. Innovation for Climate Resilience: Towards Societal Adaptation and Sustainable Transformations with Best Practice Solutions in Flood Risk Management and Governance. The Lab, UN-MERIT. https://lab.merit.unu.edu/innovation-for-climate-resilience/
- DeCock-Caspell M. & Vassuer L. Visualizations as a tool to increase community engagement in climate change adaptation decision-making. Facets (2021). https://www.facetsjournal.com/doi/10.1139/facets-2020-0032
Please note, this article will also appear in the fifteenth edition of our quarterly publication.